Core Web Vitals: Complete Guide to Measuring and Improving Page Experience

Core Web Vitals are Google’s way of measuring user experience. They directly impact your search rankings and, more importantly, how users perceive your site. Here’s everything you need to know about measuring, tracking, and improving these critical metrics.
TL;DR: Key Takeaways
- Core Web Vitals are ranking factors. Google uses three metrics — LCP (loading), INP (interactivity), and CLS (stability) — to evaluate page experience and influence search rankings.
- Field data matters more than lab data. Google ranks based on real user data from Chrome UX Report, not Lighthouse scores. Use lab data for debugging, but optimize based on field metrics.
- Mobile performance is critical. Google primarily uses mobile field data for rankings. Test on real devices and check mobile metrics separately from desktop.
- Quick wins exist for each metric. Preload LCP images, break up long JavaScript tasks for INP, and set explicit dimensions on images to prevent CLS.
- Continuous monitoring prevents regressions. Set up Google Search Console alerts and implement Real User Monitoring (RUM) to catch performance issues before they impact rankings.
- Beyond SEO, vitals impact business metrics. Faster LCP reduces bounce rates, better INP improves conversions, and lower CLS increases user satisfaction.
Table of Contents
- What Are Core Web Vitals?
- The Three Core Web Vitals Explained
- Why Core Web Vitals Matter for SEO
- Lab Data vs. Field Data
- Tools for Measuring Core Web Vitals
- Setting Up Core Web Vitals Tracking
- Improving Core Web Vitals
- Monitoring and Alerting
- Common Mistakes to Avoid
- Core Web Vitals Checklist
- Frequently Asked Questions
- Take Action on Core Web Vitals
What Are Core Web Vitals?
Core Web Vitals are three specific metrics that Google uses to evaluate page experience:
- LCP (Largest Contentful Paint) — Loading performance
- INP (Interaction to Next Paint) — Interactivity responsiveness
- CLS (Cumulative Layout Shift) — Visual stability
These metrics replaced vague concepts like “fast” or “responsive” with measurable, actionable numbers. Google officially uses them as ranking factors, making them impossible to ignore.

Note on FID vs INP
In March 2024, Google replaced FID (First Input Delay) with INP (Interaction to Next Paint). INP is a more comprehensive measure of responsiveness because it considers all interactions throughout the page lifecycle, not just the first one.
The Three Core Web Vitals Explained
LCP: Largest Contentful Paint
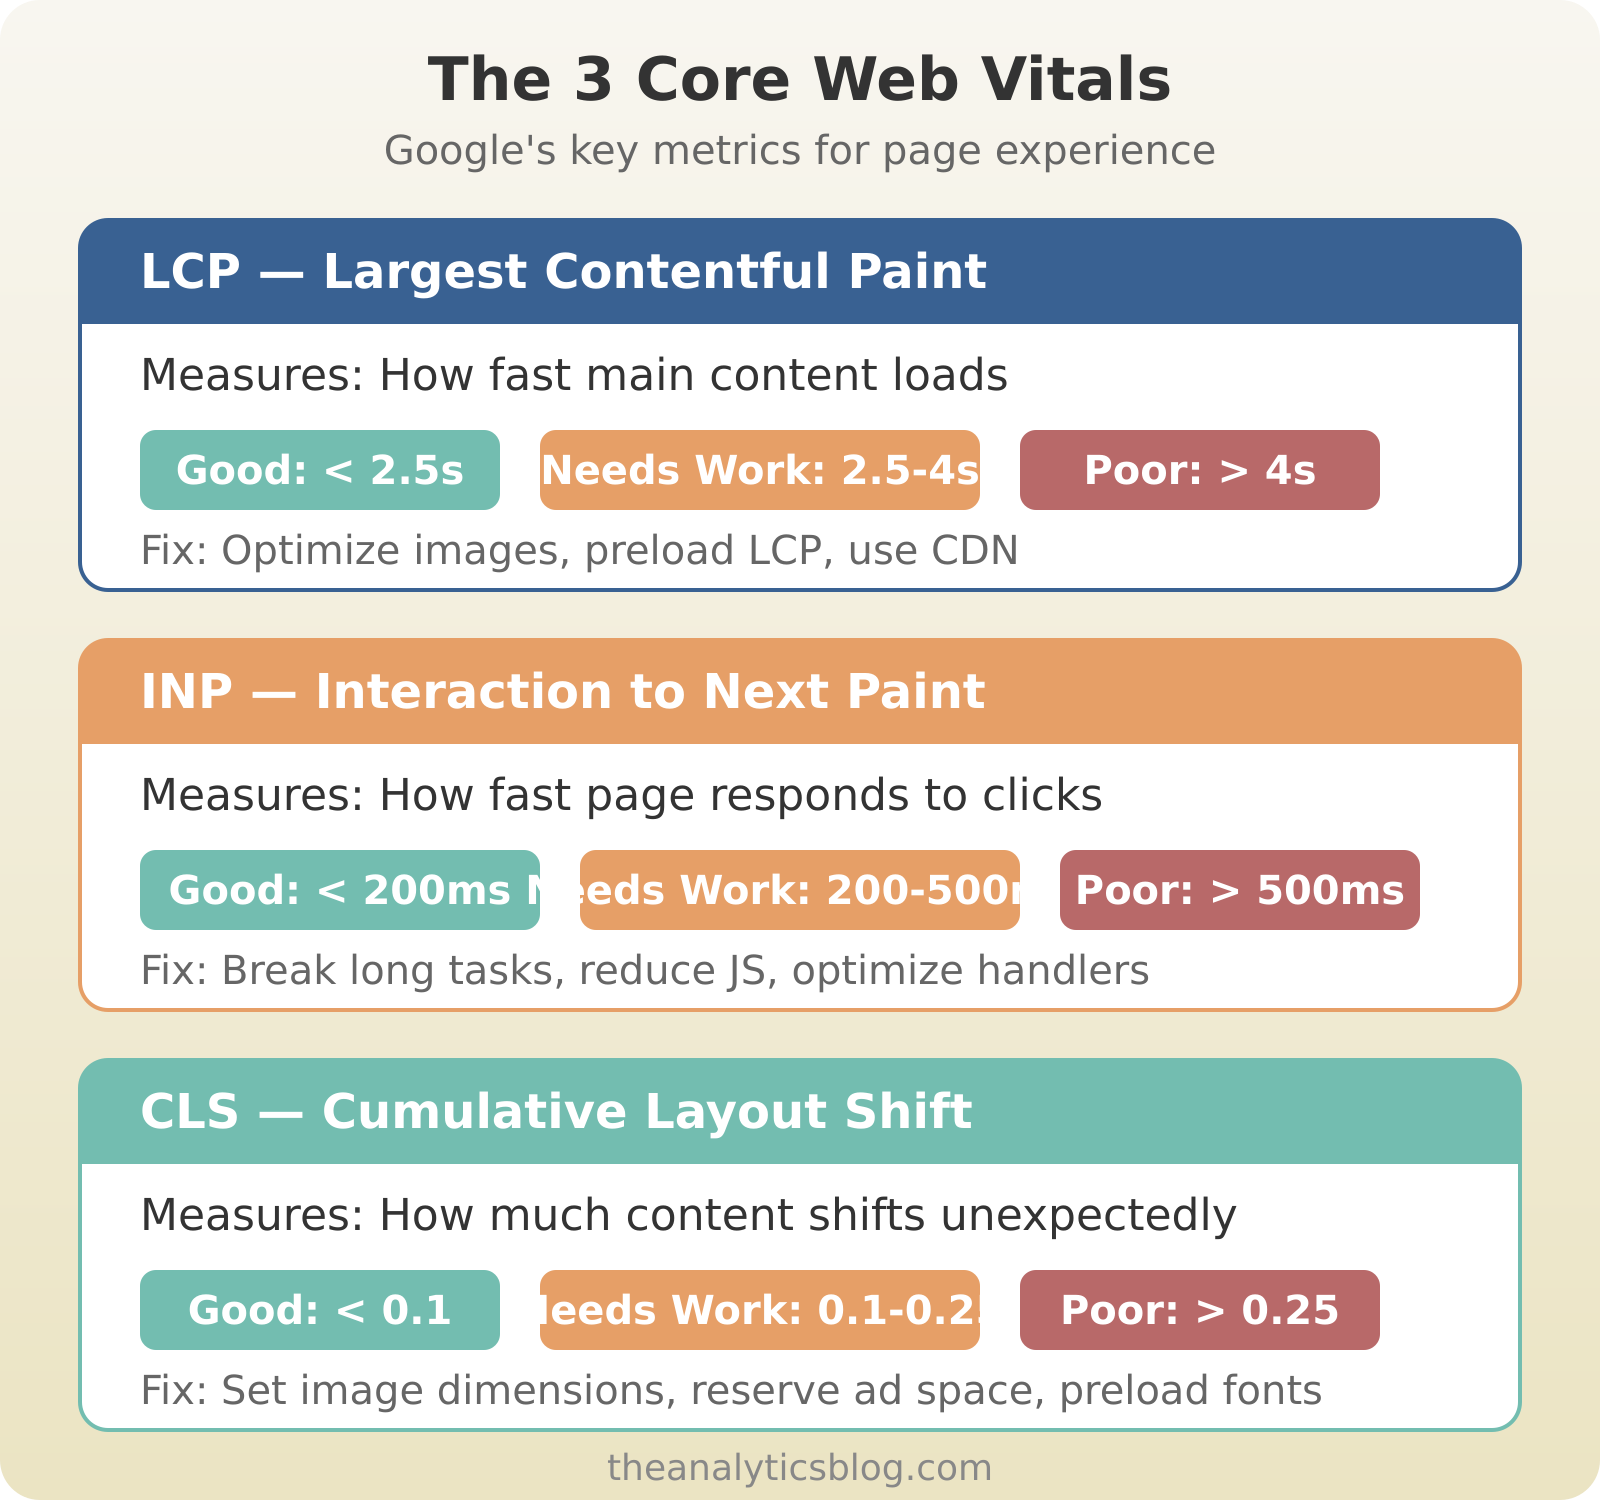
What it measures: How long it takes for the largest visible content element to load.
Why it matters: LCP is the closest approximation to “when does the page feel loaded?” Users perceive a page as ready when they can see the main content.
What counts as LCP element:
- Images (including background images)
- Video poster images
- Block-level text elements
- SVG elements
Thresholds:
- Good: ≤ 2.5 seconds
- Needs Improvement: 2.5 – 4.0 seconds
- Poor: > 4.0 seconds
Common causes of poor LCP:
- Slow server response time (TTFB)
- Render-blocking JavaScript and CSS
- Large, unoptimized images
- Client-side rendering delays
- Slow resource load times
INP: Interaction to Next Paint
What it measures: The time from when a user interacts (click, tap, keypress) to when the browser displays a visual response.
Why it matters: A slow-responding page feels broken. Users expect immediate feedback when they interact.
How it’s calculated: INP observes all interactions during a page visit and reports a single value that represents the typical worst-case latency. It’s more holistic than FID, which only measured the first interaction.
Thresholds:
- Good: ≤ 200 milliseconds
- Needs Improvement: 200 – 500 milliseconds
- Poor: > 500 milliseconds
Common causes of poor INP:
- Long JavaScript tasks blocking main thread
- Large DOM size
- Expensive event handlers
- Third-party scripts
- Heavy framework hydration
CLS: Cumulative Layout Shift
What it measures: How much page content moves around unexpectedly while loading.
Why it matters: Nothing frustrates users more than clicking a button just as the page shifts and hitting the wrong element. Layout shifts break trust.
How it’s calculated: CLS is the sum of all individual layout shift scores. Each shift score = impact fraction × distance fraction.
Thresholds:
- Good: ≤ 0.1
- Needs Improvement: 0.1 – 0.25
- Poor: > 0.25
Common causes of poor CLS:
- Images without dimensions
- Ads, embeds without reserved space
- Dynamically injected content
- Web fonts causing FOIT/FOUT
- Actions waiting for network response
Why Core Web Vitals Matter for SEO
Since 2021, Core Web Vitals have been an official Google ranking factor. But let’s be realistic about their impact:
The truth: Core Web Vitals are a tiebreaker, not a primary ranking factor. Content relevance, backlinks, and search intent still dominate. But when two pages are equally relevant, the one with better vitals wins.
Where they really matter:
- Competitive niches where many pages target the same keywords
- E-commerce category pages
- News and media sites (competing for Top Stories)
- Any industry where user experience is a differentiator
Beyond SEO: Even if Google didn’t use them for rankings, Core Web Vitals correlate with business outcomes:
- Faster LCP → Lower bounce rates
- Better INP → Higher conversion rates
- Lower CLS → Better user satisfaction
Lab Data vs. Field Data
Understanding the difference between lab and field data is crucial for accurate measurement.

Lab Data (Synthetic Testing)
Collected in a controlled environment with predefined conditions.
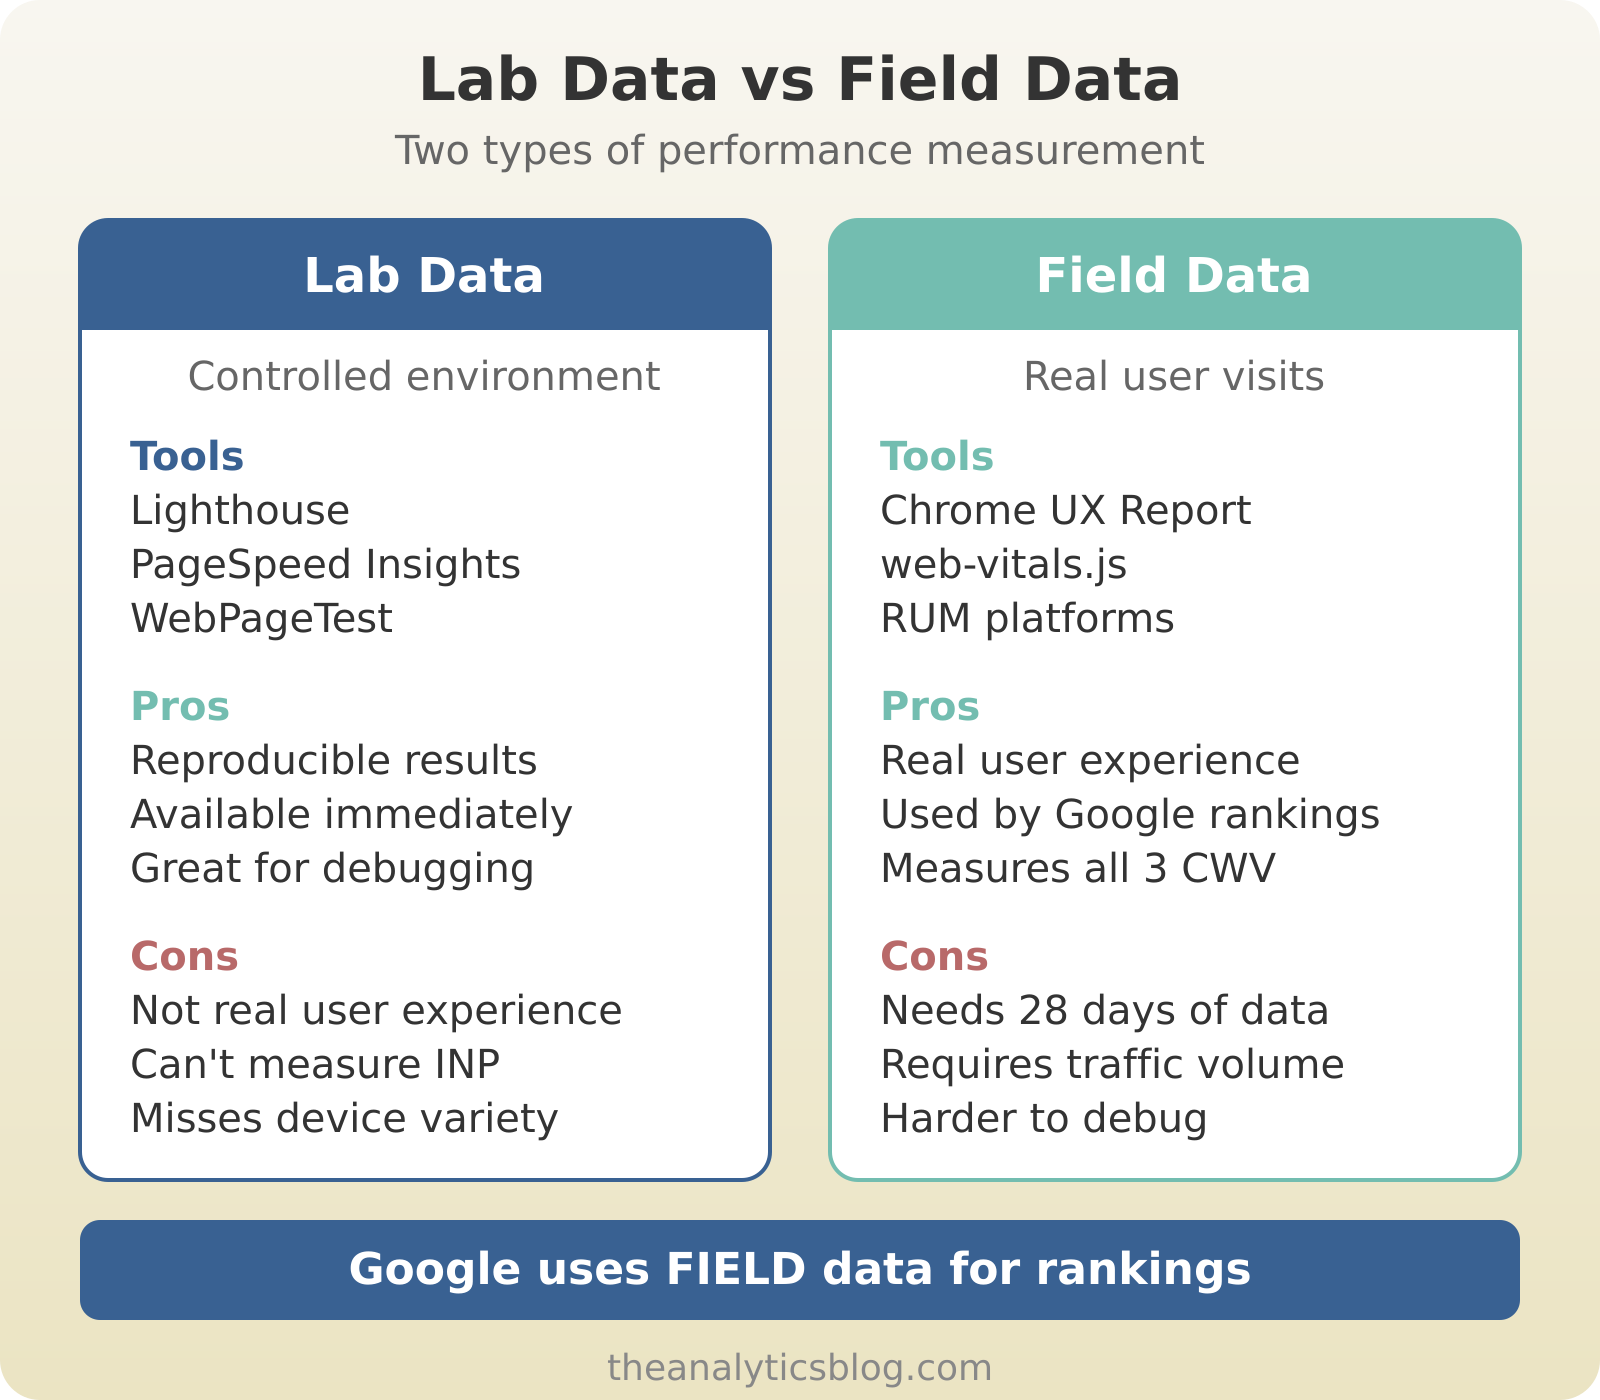
Tools: Lighthouse, PageSpeed Insights (lab section), WebPageTest
Pros:
- Reproducible results
- Available immediately
- Great for debugging
- Tests specific conditions
Cons:
- Doesn’t reflect real user experience
- Can miss device/network variations
- INP not measurable (no real interactions)
Field Data (Real User Monitoring)
Collected from actual users visiting your site.
Tools: Chrome UX Report (CrUX), PageSpeed Insights (field section), web-vitals.js
Pros:
- Shows real user experience
- Captures device/network diversity
- This is what Google uses for rankings
- Measures INP accurately
Cons:
- Requires traffic (28-day data in CrUX)
- Not available for new/low-traffic pages
- Harder to debug specific issues
Key insight: Google uses field data (CrUX) for ranking. Lab data is for debugging. Optimize based on field data, debug with lab data.
Tools for Measuring Core Web Vitals

Free Google Tools
- Shows both lab and field data
- Free, no setup required
- Per-URL analysis
- Start here for quick checks
- Core Web Vitals report for entire site
- Groups URLs by issue type
- Shows trend over time
- Essential for site-wide monitoring
- Public dataset of real user metrics
- 28-day rolling data
- Origin and URL-level data
- BigQuery access for advanced analysis
Lighthouse (Chrome DevTools)
- Built into Chrome (F12 → Lighthouse tab)
- Detailed performance diagnostics
- Actionable recommendations
- Best for debugging specific issues
Real User Monitoring (RUM) Tools
For continuous monitoring of real user data:
- web-vitals.js — Google’s official library (free, self-hosted)
- SpeedCurve — Enterprise RUM + synthetic monitoring
- Calibre — Performance monitoring platform
- DebugBear — CWV monitoring + recommendations
- Treo — CrUX-based monitoring
Privacy-Friendly Options
If you’re using privacy-first analytics, you can still track Core Web Vitals:
- Plausible — No built-in CWV, but works with web-vitals.js custom events
- Fathom — Same approach: send CWV as custom events
- Self-hosted web-vitals.js — Send to your own endpoint
For privacy-conscious implementations, consider combining Core Web Vitals tracking with server-side tracking to maintain user privacy while collecting performance data. You can also explore alternatives like Matomo vs Google Analytics for privacy-first analytics solutions.
Setting Up Core Web Vitals Tracking
Method 1: web-vitals.js (Recommended)
Google’s official library for measuring Core Web Vitals in the browser.
<script type="module">
import {onLCP, onINP, onCLS} from 'https://unpkg.com/web-vitals@3/dist/web-vitals.attribution.js?module';

function sendToAnalytics(metric) {
  // Send to your analytics endpoint
  const body = JSON.stringify({
    name: metric.name,
    value: metric.value,
    delta: metric.delta,
    id: metric.id,
    page: window.location.pathname
  });

  // Use sendBeacon for reliability
  navigator.sendBeacon('/analytics/vitals', body);
}

onLCP(sendToAnalytics);
onINP(sendToAnalytics);
onCLS(sendToAnalytics);
</script>
Method 2: Google Analytics 4
GA4 can capture Core Web Vitals as events. For a complete setup guide, see our GA4 setup guide.
<script type="module">
import {onLCP, onINP, onCLS} from 'https://unpkg.com/web-vitals@3/dist/web-vitals.js?module';

function sendToGA(metric) {
  gtag('event', metric.name, {
    value: Math.round(metric.name === 'CLS' ? metric.value * 1000 : metric.value),
    event_category: 'Web Vitals',
    event_label: metric.id,
    non_interaction: true
  });
}

onLCP(sendToGA);
onINP(sendToGA);
onCLS(sendToGA);
</script>
Method 3: Privacy-First Analytics
Send to Plausible or Fathom as custom events. For full compliance, check our GDPR compliance guide.
<script type="module">
import {onLCP, onINP, onCLS} from 'https://unpkg.com/web-vitals@3/dist/web-vitals.js?module';

function sendToPlausible(metric) {
  // Plausible custom events
  plausible(metric.name, {
    props: {
      value: Math.round(metric.value),
      rating: metric.rating // 'good', 'needs-improvement', 'poor'
    }
  });
}

onLCP(sendToPlausible);
onINP(sendToPlausible);
onCLS(sendToPlausible);
</script>
Improving Core Web Vitals
Improving LCP
Quick wins:
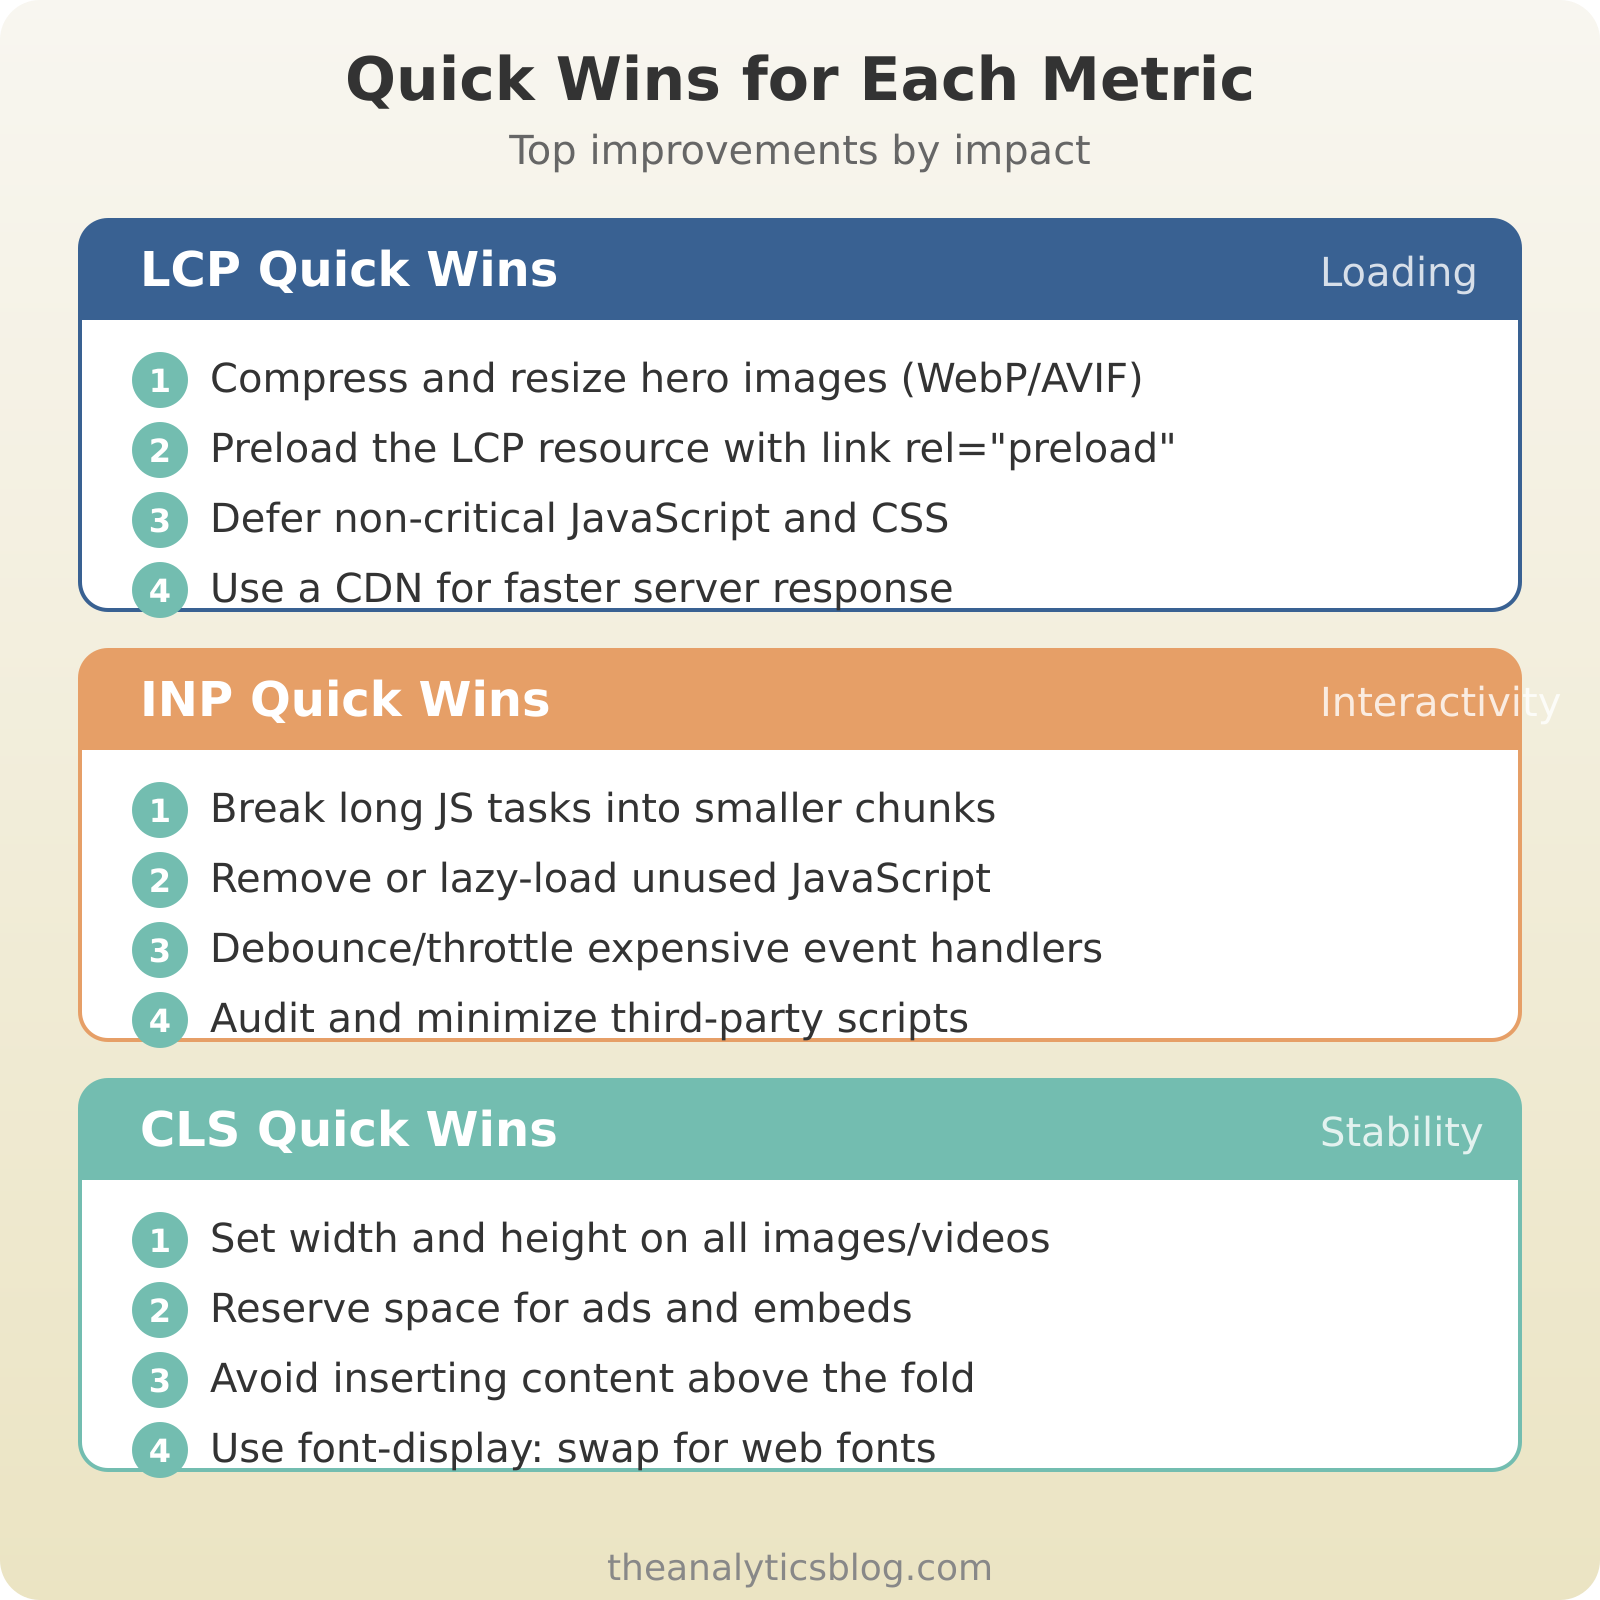
- Optimize the LCP image — Compress, use modern formats (WebP, AVIF), proper sizing
- Preload the LCP resource — <link rel=”preload”> for critical images
- Remove render-blocking resources — Defer non-critical JS/CSS
- Improve server response time — Use a CDN, optimize backend
Advanced optimizations:
- Implement critical CSS inlining
- Use responsive images with srcset
- Enable HTTP/2 or HTTP/3
- Consider edge rendering (SSR at CDN)
Improving INP
Quick wins:
- Break up long tasks — Use requestIdleCallback, setTimeout
- Reduce JavaScript execution — Remove unused code, lazy load
- Optimize event handlers — Debounce/throttle where appropriate
- Minimize third-party impact — Audit and remove slow scripts
Advanced optimizations:
- Use web workers for heavy computation
- Implement virtualization for long lists
- Optimize React/Vue hydration
- Use CSS contain property strategically
Improving CLS
Quick wins:
- Set explicit dimensions — Add width/height to images and videos
- Reserve space for ads — Use min-height for ad containers
- Avoid inserting content above existing content — Add new content below fold
- Use font-display: swap — Prevent FOIT with web fonts
Advanced optimizations:
- Use aspect-ratio CSS property
- Implement skeleton screens
- Preload fonts
- Use transform for animations (not layout properties)
Monitoring and Alerting
Set up ongoing monitoring to catch regressions early:
Google Search Console Alerts
Search Console sends email alerts when Core Web Vitals issues are detected. Make sure you:
- Verify site ownership
- Enable email notifications
- Check the report monthly at minimum
Custom Monitoring Dashboard
Build a simple dashboard using CrUX API or BigQuery:
- Track 75th percentile values over time
- Compare against thresholds
- Alert on threshold crossings
- Segment by device type (mobile vs desktop)
Automated Testing in CI/CD
Add Lighthouse to your deployment pipeline:
- Run Lighthouse CI on every deploy
- Set performance budgets
- Fail builds that regress significantly
- Track scores over time
Common Mistakes to Avoid
1. Optimizing Based on Lab Data Only
Lab data doesn’t reflect real users. A page can score 100 in Lighthouse but have terrible field metrics due to slow mobile devices or poor networks.
Fix: Always validate improvements with field data from CrUX or RUM.
2. Ignoring Mobile
Google primarily uses mobile data for rankings. Desktop-only optimization misses the point.
Fix: Test on real mobile devices. Throttle in DevTools. Check mobile field data separately.
3. Chasing Perfect Scores
A Lighthouse score of 100 isn’t the goal. Passing Core Web Vitals thresholds is. You can have a score of 85 and still pass all vitals.
Fix: Focus on the three Core Web Vitals metrics. Ignore vanity scores.
4. One-Time Optimization
Performance degrades over time as features are added. What passes today may fail next month.
Fix: Continuous monitoring. Performance budgets. Regular audits.
5. Blaming Third-Party Scripts
Yes, third-party scripts hurt performance. But you chose to add them.
Fix: Audit every third-party script. Remove what doesn’t justify its performance cost. Lazy load the rest.
Core Web Vitals Checklist
Use this checklist to ensure comprehensive coverage. For a more complete site assessment, combine this with our analytics audit checklist.
Measurement
- ☐ Checked field data in PageSpeed Insights
- ☐ Set up Search Console monitoring
- ☐ Implemented RUM with web-vitals.js
- ☐ Tracking mobile and desktop separately
LCP Optimization
- ☐ Identified LCP element on key pages
- ☐ Optimized/preloaded LCP images
- ☐ Removed render-blocking resources
- ☐ Server response under 200ms (TTFB)
INP Optimization
- ☐ No long tasks over 50ms
- ☐ Third-party scripts audited
- ☐ Event handlers optimized
- ☐ JavaScript bundle minimized
CLS Optimization
- ☐ All images have dimensions
- ☐ Ads/embeds have reserved space
- ☐ Fonts preloaded or using font-display
- ☐ No above-fold content injection
Ongoing
- ☐ Monthly Search Console check
- ☐ Performance budgets in CI/CD
- ☐ Third-party script review quarterly
- ☐ Field data validation after deploys
Frequently Asked Questions
What are Core Web Vitals and why do they matter?
Core Web Vitals are three user-centric performance metrics — LCP (loading speed), INP (interactivity), and CLS (visual stability) — that Google uses as ranking factors. They matter because they directly impact both search visibility and user experience. Sites with better Core Web Vitals typically see lower bounce rates, higher engagement, and improved conversion rates. While they’re a tiebreaker ranking factor rather than a primary one, in competitive niches they can make the difference between page one and page two.
How do Core Web Vitals affect SEO rankings?
Core Web Vitals became an official Google ranking factor in 2021. However, their impact is often misunderstood. They serve as a tiebreaker when content quality and relevance are equal between two pages. Google prioritizes content relevance, search intent, and backlink authority first. That said, in competitive industries where many sites have similar content quality, Core Web Vitals can be the differentiator that determines ranking position. They’re most impactful for e-commerce sites, news publishers, and highly competitive keywords.
What’s the difference between lab data and field data?
Lab data comes from synthetic testing in controlled environments (like Lighthouse) and provides reproducible, immediate results perfect for debugging. Field data comes from real users visiting your site and reflects actual device diversity, network conditions, and usage patterns. The critical difference: Google uses field data from Chrome UX Report (CrUX) for rankings, not lab scores. You should optimize based on field data targets but use lab data to diagnose and fix specific issues. A perfect Lighthouse score doesn’t guarantee good field performance.
How often should I check my Core Web Vitals?
Check Google Search Console monthly at minimum to monitor site-wide trends and catch regressions. For active development sites, implement Real User Monitoring (RUM) with web-vitals.js to get continuous feedback. Run Lighthouse CI on every deployment to catch performance regressions before they reach production. After major changes (theme updates, plugin additions, infrastructure changes), check both lab and field data within 2-3 weeks to verify improvements show up in real user metrics.
What’s a good Lighthouse score?
This is a common misconception: Lighthouse scores aren’t the goal. The actual Core Web Vitals thresholds are what matter. You can have a Lighthouse score of 85 and still pass all three Core Web Vitals in field data. Focus on these targets: LCP ≤ 2.5s, INP ≤ 200ms, CLS ≤ 0.1. A high Lighthouse score with poor field data means nothing for rankings. Conversely, a moderate Lighthouse score with good field metrics is perfectly fine. Optimize for the metrics, not the overall score.
How long does it take for CWV improvements to show in search?
Core Web Vitals improvements appear in Google’s systems at different speeds. Chrome UX Report (CrUX) uses a 28-day rolling window, so field data improvements take at least a month to fully reflect. Google Search Console typically updates weekly but shows 28-day aggregates. For ranking impacts, expect 1-3 months after consistently passing thresholds, as Google needs time to recrawl, re-evaluate, and adjust rankings. Make improvements, verify in field data after 28 days, then watch Search Console and rankings over the following 2-3 months.
Take Action on Core Web Vitals
Core Web Vitals aren’t just about SEO — they’re about building websites that don’t frustrate users. Fast loading, responsive interactions, and stable layouts are the minimum expectations in 2026.
Start by measuring your current state with PageSpeed Insights and Search Console. Identify your worst-performing pages. Fix the biggest issues first. Then set up monitoring to prevent regressions.
Remember: you’re optimizing for real users, not Lighthouse scores. Field data tells the true story.
Next Steps:
- Implement tracking with our GA4 setup guide to monitor Core Web Vitals alongside other metrics
- Use our analytics audit checklist to ensure proper measurement infrastructure
- Understand how performance data fits into your broader strategy with our marketing attribution guide
- Ensure privacy compliance while tracking with our GDPR compliance guide
Need help optimizing your Core Web Vitals? Get in touch — I’ve helped sites go from failing to passing across all three metrics.
Web Analytics Consultant
Web analytics consultant with 10+ years of experience helping businesses make data-driven marketing decisions. Former Senior Analytics Lead at a Fortune 500 company, now focused on privacy-first analytics solutions and helping companies move beyond Google Analytics.
View all articles →